As someone who lives and works in Northampton, I completely understand the concerns some people have about feeling like we’re packed in. At times, especially during the rush hours, it can feel a bit tight, but when we look at the data, the picture is quite different.

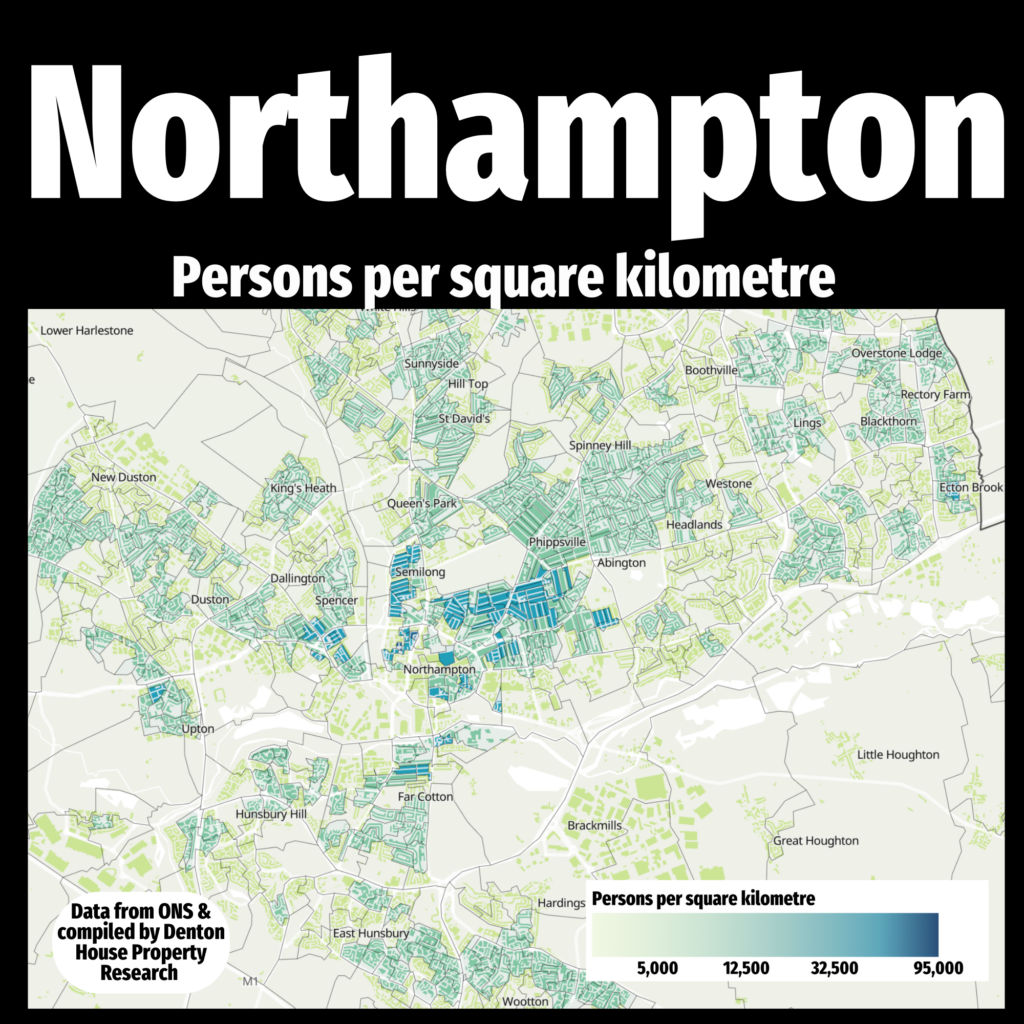
The map above shows population density across Northampton, and what’s clear is that, compared to many other towns and cities, we’re far from crammed in. The light green areas show where population density is low, light blue has medium population density and the dark blues high population density, where more people live per square kilometre. As you can see in the map, Northampton has nothing extreme and mostly green with pockets of light blue. There are areas in the UK with the dark blue areas and they tend be in central London and few other larger cities in the UK.
This means Northampton offers a balance — we have the benefits of a decent-sized town without the feeling of being overcrowded.
We’re quite lucky to have plenty of open spaces, a good mix of housing, and areas that give families, couples, and individuals room to breathe. So, while it might feel a bit hectic at times, the reality is that Northampton remains a comfortable and spacious place to live. As a local estate agent, I can assure you that the property market here reflects this. We’re not bursting at the seams — instead, we have a town that offers both community and personal space.
Tell me your thoughts in the comments.


