✅ Listings (New Properties on the Market)
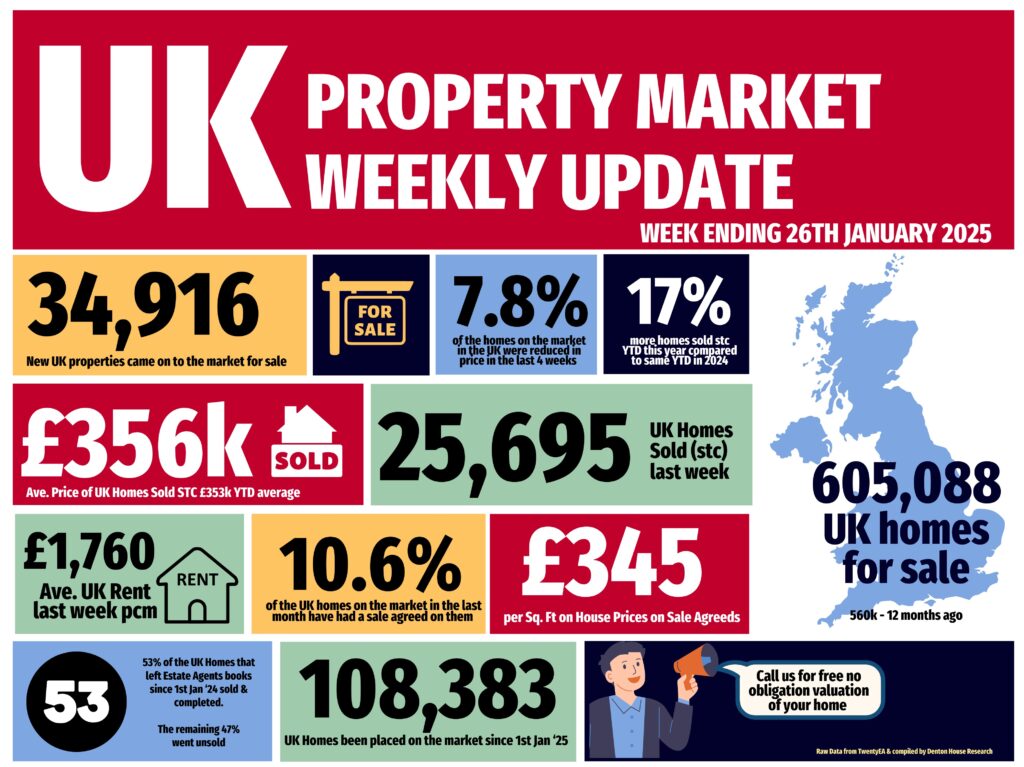
34.9k new listings this week (last week 33.7k)
That’s 17% higher than Week 3 of 2024 YTD and 14% higher YTD compared to 2017/18/19.
✅ Price Reductions (% of Resi Stock)
19.9k Price Reductions this week – meaning approx. 14.8% of Resi sales stock this month has been reduced.
To compare, 7.8% of residential sales stock reduced in December (always a lower % in Dec).
For comparison, 11.1% od stoics reduced in November and 11.9% average in 2024, though the long-term 5-year average is 10.6%. December traditionally sees a dip in this metric.
✅ Total Gross Sales (Agreed Sales)
25.7k UK homes sold STC this week, up from 23.8k last week in Week 2
That’s 35% higher YTD compared to 2024 and 43% higher than 2017/18/19 YTD levels.
✅ Sale-Through Rate (Monthly in Arrears)
Approx. Run rate of 14.2% of Resi stock sold stc in Jan. For comparison, 10.61% of residential sales stock sold in December 2024, compared to 8.79% in December 2023. 2024 monthly average: 15.3%. Long-term 7-year average: 17.9%.
✅ Sale Fall-Throughs
23.3% of gross sales fell through this week – ad top from last week at 25.4%. Slightly below the 7-year average of 24.2%, but well below the 40%+ levels post-Truss Budget (Autumn 2022).
On a monthly basis, approximately 5.4% of sales in the UK agents pipelines have fallen thru in Jan 25. For comparison, 3.8% of the December 2024 sales pipeline fell through (Dec is always lower) (2024 average: 5.36%).
✅ Net Sales (Gross sales for the week less Sale Fall Thrus for the week)
19.7k net sales this week, compared to a typical week 3 average of 18.1k. Last week (Week 2 2025) – 17.7k.
2025 YTD is 38% higher than compared to 2024 YTD and 39.7% higher than YTD 2017/18/19.
✅ Residential Sales Stock on the Market
605k properties on the market at the end of December 2024 (down from 677k in November).
Historical comparison for end of December:
• 2023: 560k
• 2022: 481k
• 2021: 342k
• 2020: 543k
• 2019: 545k.
✅ Residential Sales Sold STC Pipeline
441k sales agreed but not yet completed at the end of December 2024.
Historical comparison for December :
• 2023: 359k
• 2022: 373k
• 2021: 468k
• 2020: 548k
• 2019: 310k.
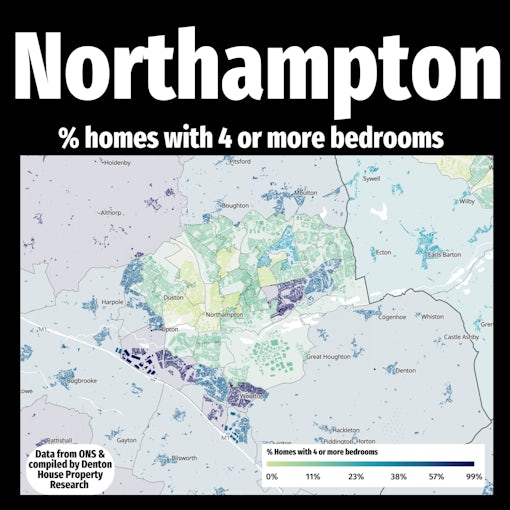
✅ UK House Prices (£/sq.ft)
As always, the £/sq.ft metric predicts Land Registry figures 5 months in advance with 92% accuracy (the orange line of the graph).
December’s final figure: £339/sq.ft.
• November: £342/sq.ft
• August: £334/sq.ft
• December 2023: £322/sq.ft
This means house prices have risen 5.28% in the last 12 months.
If you would like to chat to us about our local property market, feel free to call us on 01604 626 626 or drop us a line at northampton@belvoir.co.uk