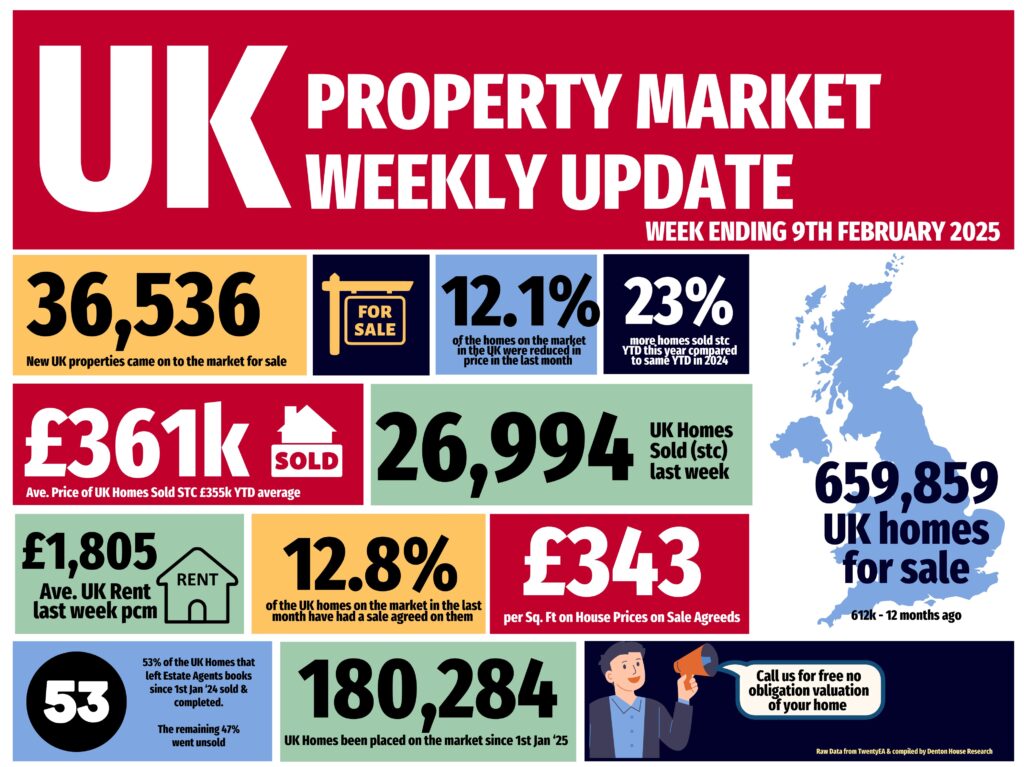
✅ Listings (New Properties on the Market)
36.5k new listings this week (last week 35.9k)
That’s 11% higher than Week 5 of 2024 YTD and 11% higher YTD compared to 2017/18/19.
✅ Price Reductions (% of Resi Stock)
21.5k Price Reductions this week – meaning an approx run rate of 1 in 8 of Resi Sales stock per month is being reduced (12%).
For comparison, 11.9% average in 2024, though the long-term 5-year average is 10.6%.
✅ Total Gross Sales (Agreed Sales)
27k UK homes sold STC this week, down from 27.5k last week in Week 4
That’s 24% higher YTD compared to 2024 and 33% higher than 2017/18/19 YTD levels.
✅ Sale-Through Rate (Monthly in Arrears)
January’s Run rate of 15% of Resi stock sold stc. For comparison, 13.9% of residential sales stock sold in January 2025. 2024 monthly average: 15.3%. Long-term 8-year average: 17.9%.
✅ Sale Fall-Throughs
6,406 Sale fall-thrus last week from Resi Sale Sales Pipeline of 440,431 homes sale agreed (sold stc).
Another method is that week’s sale fall thrus as a % of gross sales that week. This week, that is 23.7% (last week 22.5%). Still slightly below the 7-year average of 24.2%, but well below the 40%+ levels post-Truss Budget (Autumn 2022).
For January ’25 as a whole, 6.03% of sales in the UK agents pipelines fell thru in Jan 25. For comparison, 2024 average: 5.36%.
✅ Net Sales (Gross sales for the week less Sale Fall Thrus for the week)
20.6k net sales this week, compared to a typical week 4 average of 19.4k. Last week
Week 4 2025 – 21.3k. 18.4k is the weekly YTD 2025 average.
2025 YTD is 23% higher than compared to 2024 YTD and 26% higher than YTD 2017/18/19.
If you would like to chat to us about our local property market, feel free to call us on 01604 626 626 or drop us a line at northampton@belvoir.co.uk