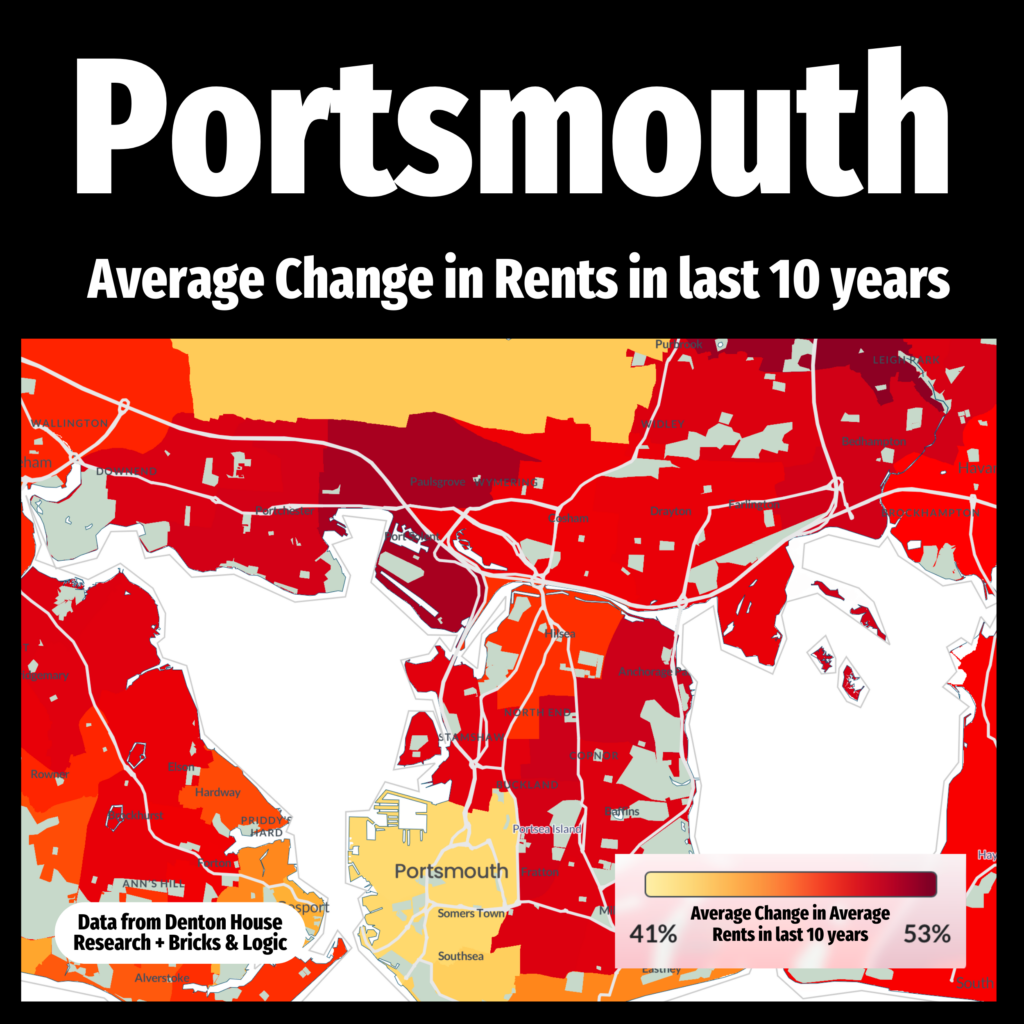
The Portsmouth rental landscape has undergone significant changes in the past decade, and understanding these shifts is crucial for any astute landlord. To illuminate these trends, I have created an insightful heat map that vividly depicts the evolution of average rental prices across Portsmouth over the last 10 years.

This heat map isn’t just a colourful representation; it’s a powerful tool that reveals patterns and trends in rental pricing, providing a clear visual of how different areas in Portsmouth have developed. This decade-long perspective is invaluable for landlords looking to adapt to the changing market and identify emerging opportunities for investment.
Portsmouth’s growth, influenced by factors like local economic development, infrastructure improvements, and demographic shifts, is reflected in these changing rental prices. As a property agent deeply embedded in the Portsmouth property scene, my goal is to provide landlords with cutting-edge tools and insights like this heat map.
For landlords seeking to align their strategies with Portsmouth’s evolving dynamics, or for those curious about the potential impacts of these changes on their investments, we’re here to offer tailored advice and in-depth analysis. Let’s discuss how these insights can shape your property decisions and enhance your portfolio’s performance in Portsmouth’s dynamic rental market.


